The GTM Metrics That Will Define 2026 (And Why Most Companies Will Miss Their Targets Before Q2)
The Founder Who Did Everything "Right"… and Still Fell Behind
In July, a founder of a $25M ARR SaaS company told us something we hear every week:
"We doubled outbound. We increased spend. We hired more reps. But somehow… we're growing slower."
Pipeline was up. Activity was up. Marketing was louder than ever.
Revenue? Flat.
Then he said the line that defined the entire conversation: "It feels like we're measuring everything… except what actually matters."
And he was right.
2026 will be the first year where companies won't miss revenue because of low pipeline or bad execution. They'll miss because they measured the wrong things—or worse, they confused activity metrics with outcome metrics.
This isn't a new problem. But the stakes have changed. With AI-augmented teams, multithreaded buying processes, and CAC inflation hitting every channel simultaneously, traditional GTM measurement frameworks no longer predict success. They report failure… after it's too late to fix.
Why 2026 Requires Different Metrics
The GTM world has fundamentally changed—and most executive teams haven't updated their dashboards to match reality:
Buyers are multithreaded – 3-7 stakeholders influence every mid-market decision, yet most CRMs still track single-contact deals
CAC is rising unpredictably – paid gets noisier, organic gets harder, outbound gets less responsive
AI redefined productivity – your best rep uses AI best, not works longest
Pipeline is no longer the leading indicator – velocity, ICP accuracy, and retention tell the real story
From an investor perspective, the companies that secure Series B funding in 2026 won't be those with the biggest pipeline -they'll be the ones who can prove engine efficiency at scale. Boards are asking tougher questions: "What's your GTM efficiency trendline?" and "How does AI impact your CAC payback?"
For founders still optimizing for pipeline coverage ratios, these questions feel unfair. But they're not. They're the new standard. And building a mature RevOps function is how you get there.
2026 will be dominated by companies that measure differently, not those that work harder.
The 12 GTM Metrics That Will Define 2026
Below is Phi’s 2026 GTM Precision Framework the metrics that predict revenue, not just report it. Each metric addresses a specific failure mode we see across growth-stage companies.
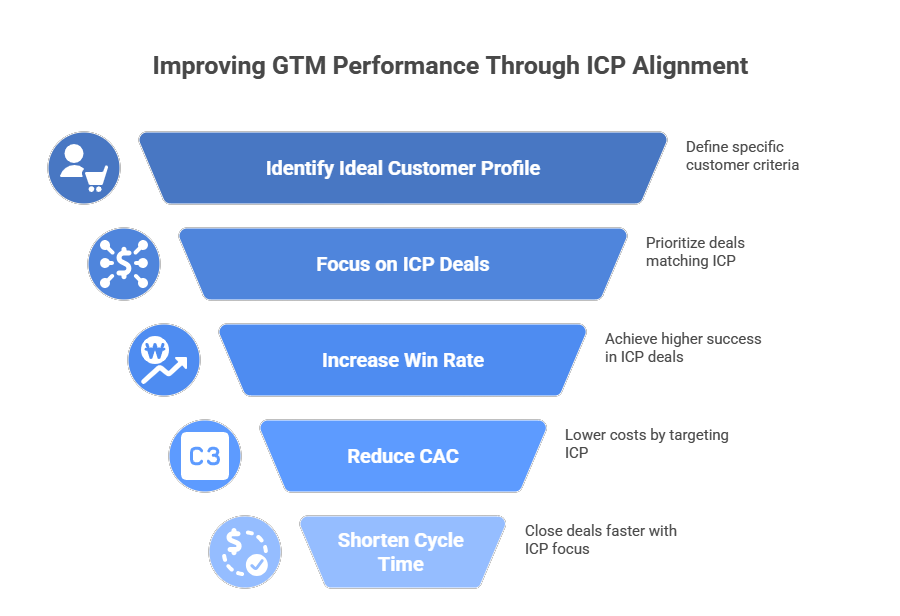
1. TRM Accuracy Score
What it is: The percentage of closed-won deals that match your Ideal Customer Profile criteria.
Why it matters: A FreightTech company we advised believed their TAM was 300,000 fleets. Their revenue came from only one band: 25–99 trucks. Once we fixed their Total Reachable Market definition, everything improved – win rate, CAC, cycle time, expansion.
If you're winning deals outside your ICP, you're building a retention nightmare. Every misfit customer drags down NRR, creates support noise, and dilutes your product roadmap. From a product perspective, these customers generate feature requests that pull you away from your core market.
Benchmark: 70%+ of wins should fit your ICP definition.
Operational insight: When a startup we worked with in the logistics space tightened their ICP from "any trucking company" to "fleets with 25-99 trucks using legacy TMS systems," their win rate jumped from approximately 18% to 41% in 90 days. The deals also closed roughly 30% faster.
2. Pipeline Velocity Index (PVI)
What it is: A weighted score measuring how fast deals move through each pipeline stage, factoring in conversion rates and time spent per stage.
Why it matters: A SaaS company had beautiful pipeline numbers but died in Stage 2 (technical validation). Forecast didn't catch it. PVI did. Velocity collapses before revenue collapses – usually 60-90 days before your forecast shows the miss.
Traditional pipeline reporting shows volume. PVI shows momentum. And momentum is the earliest predictor of revenue outcomes. This is a core element of effective GTM execution measurement.
Benchmark: Track week-over-week trends. A 15%+ drop is an early warning system.
CEO perspective: One founder told us, "PVI gave us 8 weeks of runway to fix our demo-to-eval conversion problem before it cratered our quarter. That's the difference between a miss and a save."
3. Revenue Velocity by Motion (RVM)
What it is: Revenue generated per day by each GTM motion (outbound, inbound, partner-led, PLG), calculated as:
(# of deals × avg deal size × win rate) / avg sales cycle days
Why it matters: A FinTech client thought outbound was their engine. RVM showed partner-led deals were 3× faster and 2× higher margin. Your real GTM engine is often not the one you invest in.
Most companies allocate headcount and budget based on what's always been done, not on what actually produces efficient revenue. RVM forces motion-level accountability.
Action: Build motion-level P&L. Kill underperforming motions. This connects directly to choosing the right GTM motion to scale.
Customer journey insight: From the buyer's perspective, partner-led deals often convert faster because trust is pre-built. The partner acts as a validator, reducing the buyer's perceived risk.
4. CAC Payback by ICP Tier
What it is: Time to recover customer acquisition costs, segmented by ICP tier (A, B, C customers).
Why it matters: One founder bragged about 13-month CAC. Segmented CAC told the truth: A-tier was 7.5 months, B-tier was 12 months, C-tier was 38 months. They didn't realize a third of their customers were unprofitable.
Blended CAC hides the truth. Segmented CAC reveals which parts of your GTM motion are actually destroying value. For early-stage companies, this is often the difference between efficient growth and a death spiral. Our detailed CAC optimization strategies dive deeper into this.
Benchmark: C-tier payback should never exceed 18 months. If it does, stop selling to them.
Investor lens: VCs increasingly ask for CAC payback by cohort and tier. Blended numbers don't cut it anymore. They want to see unit economics at the segment level.
5. Product Activation Time (PAT)
What it is: Time from contract signed to customer achieving their first "Aha Moment" (not first login-actual value delivery).
Why it matters: A client cut activation from 28 days to 8. NRR jumped, churn dropped, expansion surged. Faster activation creates momentum. Momentum creates retention. Retention creates expansion.
From a customer success perspective, activation is the most critical window. If customers don't see value fast, they start second-guessing the purchase decision. That's when churn risk begins—long before renewal.
Benchmark: <15 days for SaaS, <30 days for complex enterprise products.
Operational example: When implementing onboarding optimization for a cloud infrastructure client, we mapped every friction point in their activation journey. By removing unnecessary configuration steps and adding proactive CS check-ins at Day 3 and Day 7, they reduced activation time by approximately 60%.
6. Expansion Efficiency Ratio (EER)
What it is: Expansion ARR divided by the cost of your customer success and account management teams.
Why it matters: New logo CAC is rising. Expansion CAC stays flat. The cheapest revenue is already in your base. 40-60% of growth should come from existing customers in 2026.
Most companies treat customer success as a cost center. High-performing companies treat it as a revenue engine. EER measures how commercial your CS team actually is.
Benchmark: EER >3.0 is good. <1.5 means your CS team isn't commercial enough.
Founder insight: "We had 8 CSMs focused on 'happiness.' Zero expansion. We reorganized around commercial outcomes, trained them on upsell triggers, and EER went from 0.7 to 3.4 in one quarter." – Series B SaaS founder
7. Margin-Adjusted NRR (MA-NRR)
What it is: Net Revenue Retention weighted by gross margin percentage of each customer cohort.
Why it matters: A FinTech client had 128% NRR. When weighted by margin? 91%. They were retaining and expanding low-margin accounts while losing high-margin ones. Traditional NRR hides the truth. MA-NRR exposes it.
Standard NRR treats all revenue as equal. But not all revenue is created equal. A dollar of 80% margin revenue is worth far more than a dollar of 20% margin revenue-especially at scale.
Action: Segment CS efforts by customer margin, not just ARR. This is part of a broader data-driven GTM strategy.
CFO perspective: MA-NRR is the metric that should drive compensation planning for customer success and account management teams. Rewarding retention without considering margin creates perverse incentives.
8. GTM Efficiency Ratio v3 (GTM ER v3)
What it is: Net new ARR divided by total GTM costs (sales + marketing + CS + tooling), enhanced with AI productivity factors and cost per funnel stage.
Why it matters: Boards will ask: "What is your GTM efficiency trendline over the last 90 days?" This is the new "Rule of 40" for growth-stage companies.
Traditional efficiency ratios don't account for AI impact. A rep using AI for research, email generation, and meeting prep can handle 2-3× the pipeline of a non-AI rep. GTM ER v3 adjusts for this reality.
Benchmark: >0.8 is good, >1.2 is exceptional.
Example from our work: With a B2B SaaS startup, we implemented AI-powered sales workflows (research automation, email generation, CRM updates). Their GTM ER improved from 0.6 to 1.1 in two quarters-without adding headcount. Understanding how RevOps steers GTM strategy is critical here.
9. Revenue Leak Rate (RLR)
What it is: The percentage of pipeline value lost to preventable causes-unworked leads, stuck deals, single-threaded opportunities, ignored churn signals.
Why it matters: We found a client was "leaking" more pipeline than they were losing to competitors: 19% inbound unworked, 31% stuck at compliance, 26% single-threaded, 14% churn signals ignored. Fixing leak produced more revenue than doubling top-of-funnel.
Most companies obsess over generating more pipeline. The best companies obsess over not wasting what they already have. RLR measures execution discipline.
Benchmark: Total RLR should be <15%. Anything above 20% is a crisis.
Operational drill-down:
-
Unworked inbound: Leads that came in but were never contacted (routing failures, rep capacity issues)
-
Stuck deals: Opportunities that haven't moved in 30+ days
-
Single-threaded: Deals with only 1 contact (high ghosting risk)
-
Ignored churn signals: Customers showing red flags (low usage, support complaints, no expansion)
10. AI Utilization Score (AUS)
What it is: Weighted score (0-100) measuring AI adoption across email generation, meeting intelligence, content creation, research, forecasting, and CRM automation.
Why it matters: 2026's top-performing reps won't be the hardest-working. They'll be the most AI-augmented. We're seeing 2-3× productivity gaps between high-AUS and low-AUS reps doing the same job.
The companies that scale efficiently in 2026 won't hire more reps-they'll multiply the output of existing reps with AI. This is the shift from hiring headcount to scaling with AI.
Benchmark: Team average should be >50 by Q2 2026.
From the rep's perspective: "I used to spend 4 hours a day on research, email follow-ups, and CRM updates. Now AI handles 80% of that. I spend my time on calls and strategy." – AE at a Series B company
11. Multithreaded Deal Ratio (MDR)
What it is: Percentage of deals in Stage 3+ with 3+ active contacts (economic buyer + technical buyer + champion minimum).
Why it matters: If MDR <50%, your pipeline is lying to you. Single-threaded deals have a 75-85% loss rate in late stages. Deals with only one contact almost always die when that person ghosts, changes jobs, or loses internal political capital.
Benchmark: >60% for mid-market, >75% for enterprise.
Buyer journey reality: In 2026, buying decisions in B2B involve 6-10 stakeholders on average. If you're only talking to one, you're not in the real conversation. You're in the polite-no conversation.
Tactical advice: Track MDR weekly. If a deal enters Stage 3 without 3+ contacts, it should trigger an automatic workflow: "Who else should we involve?"
12. C.A.T. Score (Clarity, Alignment, Trust)
What it is: A cultural health score measuring whether teams understand priorities (Clarity), work toward the same goals (Alignment), and trust each other and leadership (Trust).
Why it matters: We've tracked C.A.T. scores across 40+ companies. Every time it dropped below 70%, revenue missed 90-120 days later. Cultural misalignment destroys execution before it shows up in metrics.
Most GTM failures aren't technical-they're cultural. When sales doesn't trust marketing's leads, when CS doesn't trust sales' promises, when leadership doesn't trust the forecast-execution collapses.
Benchmark: >75 is healthy, <65 is danger zone.
How to measure it: Quarterly anonymous surveys with 10-15 targeted questions. Track trends over time. C.A.T. is a leading indicator of operational health.
A Founder's Turnaround: What Happens When You Measure the Right Things
The founder from the intro rebuilt his GTM engine using this framework. In 90 days:
-Win rate: +91% (23% → 44%)
-CAC payback: -28% (13mo → 9.4mo)
-Sales cycle: -17 days
-Forecast accuracy: +40 points (58% → 98%)
-NRR: 103% → 121%
-Expansion now exceeds new logo revenue
He told us: "For the first time in 18 months… I actually understand how our revenue engine works."
Cost of implementation: $47K
Revenue impact Year 1: $3.2M incremental ARR
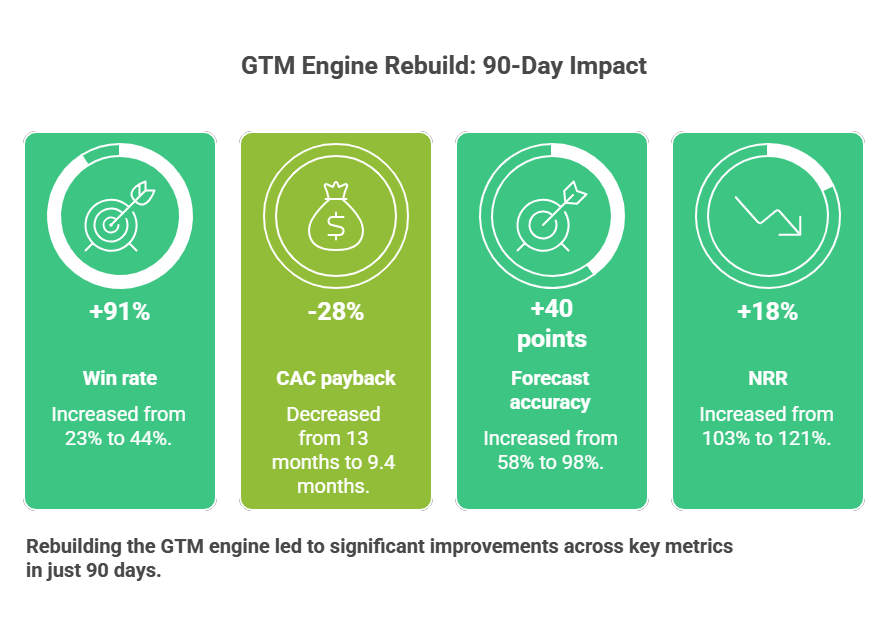
That's the power of precision metrics. This transformation followed our GTM strategy execution playbook – focused, measurable, and tied to revenue outcomes.
Where Competitor Frameworks Fail
Your competitor's GTM model misses:
-AI impact
-Revenue leakage
-Activation velocity
-Expansion efficiency
-Multithreading
-Motion-level economics
-Velocity as a leading indicator
-Margin weighting
-Cultural alignment
Most frameworks measure outcomes. Ours measures engines.
That's the difference between knowing what happened and knowing what will happen.
What These Metrics Actually Change for CEOs
These 12 metrics help CEOs answer the only questions that matter:
Where should we invest? (RVM shows which motions produce revenue, not noise)
Where should we cut? (CAC by tier shows what destroys margin)
Where are we leaking revenue? (Fixing leaks is faster than building pipeline)
How do we hit the number without adding headcount? (AI + precision, not brute force)
What will cause our next miss? (And how do we prevent it now)
From a board perspective, these aren't "nice to have" metrics. They're the metrics that determine whether you get your next round, hit your revenue plan, or run out of runway trying.
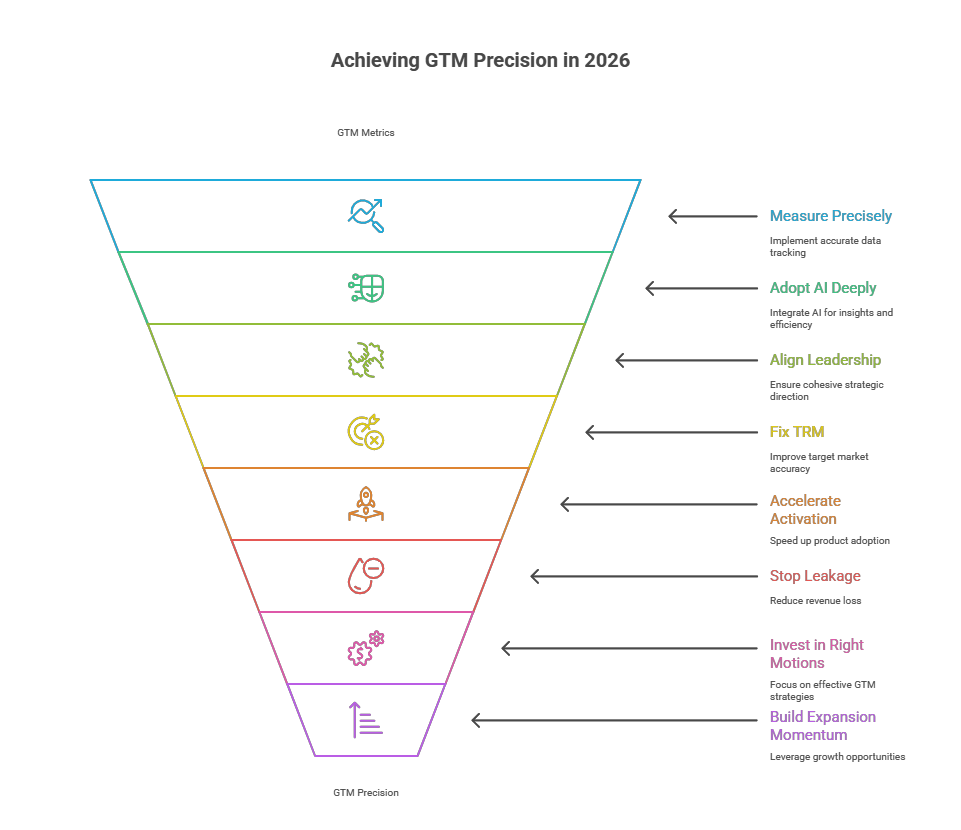
2026 Will Reward Teams Who Measure Differently
Most companies will chase volume, overhire, overspend, misalign, and try to "out-activity" the market.
The companies that win will:
– Measure precisely
– Adopt AI deeply
– Align leadership
Fix TRM
– Accelerate activation
– Stop leakage
– Invest in the right motions
– Build momentum from expansion
2026 doesn't reward effort. It rewards precision.
The startups securing Series B funding won't be the loudest – they'll be the ones with clean unit economics, efficient GTM motions, and predictable revenue engines. Investors are tired of "pipeline theater." They want proof of engine efficiency.
Build Your 2026 GTM Engine With Phi Consulting
Phi Consulting has helped:
– AtoB grow from 72 customers to 7% market share– Shipwell build a predictable outbound engine
– DataTruck scale 10× via modern GTM systems– TruckX go from $2M to $16M ARR in 14 months
We don't build dashboards. We build GTM engines that hit the number.
→ Book a 15-minute GTM scoping call. No pitch. Just truth.